

Good Bye $400’s
Hello $500’s!!
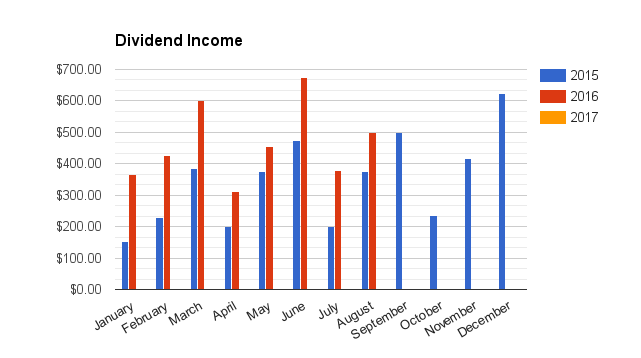
I received $501
in dividends in AUGUST.

My year over year increase was 33.60%
My quarter over quarter increase was 9.87%
Every quarter there are 3 months or dividend payouts, this is the middle one.
My total dividend haul this year is now $3616
I’m on pace to pass my last year total next month!
With 4 more months of dividend growth, this is going to end up being a most excellent year.
I love them dividends!
Market Musings
The Dow kept on pushing record highs in August off weak earnings.
I like to use the Schiller P/E ratio to gauge the value of the overall market.
August – S&P 500 had a Shiller P/E: 27. Up (being bad) 0.1
from July
That is 61.7% higher than the historical mean of 16.7
Prof. Robert Shiller of Yale University, who won the Nobel Prize in Economic Sciences in 2013 – invented the Schiller P/E to measure the market’s valuation. He also predicted the crazy P/E ratios of the late 90’s would turn out to be a bubble.
I continue to move to safety.
Moves in August

Total Purchases $7393
Total Sales $4719
I sold 120 shares of AP.UN this month at $39.33 per share for a total of $4719. That equals a 25% capital gain since Feb 24, not including dividends.
AP.UN has heavy exposure to Toronto and has shot up above what I consider a reasonable level. It’s P/E, payout ratio and distribution started to look suspect.
I bought 332 shares of TSE:NVU.UN at a price of $22.27 per share for a total of $7393. This brings my total shares to 547. Hahaha, I bought this the day before the earnings report was released which I try to always avoid. I’m not sure why I never looked when the next report was due but live and learn. The new earning report was not great but is no reason for me to panic. The shares dropped the day after I bought them down to $20. Lesson! Don’t buy off old news.
Following Step #2 in 3 simple steps to becoming rich, I’ve added another $3000 into savings cash.
I’m just about $50,000 with cash and bonds now. This will supply me with what I need if the market decides to start making sense again.
Going forward

“Only when the tide goes out do you discover who’s been swimming naked.” -Warren Buffett
I will be allocating 25% to bonds and 75% to stocks until the end of the year when I will rebalance and change directions if need be.
My plan is to buy one or two companies on my U.S. watch .
I will look to buy heavy if the DOW gets as low as 17000.